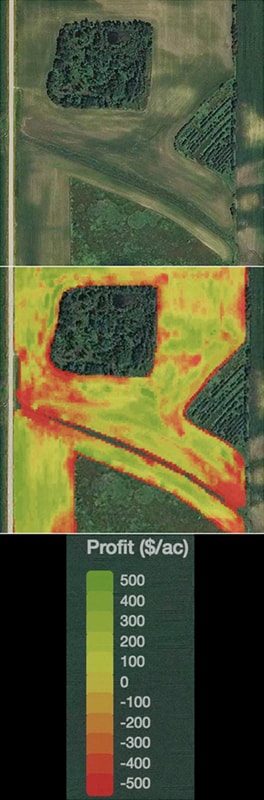
These types of comparative field images are helping farmers improve profitability.
Top: Aerial field viewed by the naked eye just shows wet and dry areas.
Middle: Aerial field view through precision ag technology. The red areas show profit loss; green areas indicate profitable areas of the field.
Bottom: Possible range of profitability.
Low-yielding money robbers are hiding in every field. Every farmer knows them—the wet spots turned to dried mud or weeds by harvest, the less obvious patches where a yield monitor plunges as the combine moves across them. Now farmers and conservation experts have an eye on those spots as potential areas to improve profitability and water quality.
Until last year, Tim Recker who farms near Arlington, Iowa wasn’t considering using a more precise way of farming. Now he’s part of a trend toward using precision technology to analyze exactly how much money is lost or made from each acre. In some cases, that leads to increased conservation practices for increased profitability.
Recker is testing a new consulting service and computer analysis from AgSolver, an Ames-based firm. But there are several options available for farmers. AgSolver’s approach shows the per-acre return on investment with maps of a field down to 10-foot resolution. “It’s a new perspective of looking at our fields, which I like. It’s not just about yield. It’s about profitability,” Recker says of AgSolver’s Profit Zone Manager app.
Recker found that a strip of continuous soybeans protecting his seed corn from stray pollen was one money-loser. So was a field edge near a farmstead windbreak. Analysis of his yield data and input costs showed negative returns of $150 to $200 an acre.
“I knew it, but I needed something in black and white that showed you’re losing money in those areas,” he says.
After the AgSolver app analyzed options he decided to enroll 10 acres in the U.S. Department of Agriculture’s (USDA) pollinator habitat program. Last year Recker used precision business planning on two farms. “This year I’m doing all of them,” says Recker, who is a past president of the Iowa Corn Growers Association and is on the Iowa Agriculture Water Alliance (IAWA) Advisory Council.
Recker isn’t alone. Other input suppliers provide map-based analysis such as the R7 Tool offered by WinField Solutions, a Land O’Lakes company. Staff at the Iowa Soybean Association also can help producers use map-based information to look at inputs, returns and potential management options. Farmers can access any of these options.
Heartland Co-op already has 10 to 15 growers in western Iowa signed up for a program that partners with AgSolver, Pheasants Forever and USDA’s Natural Resources Conservation Service, says Thomas Fawcett, precision ag field manager for the co-op. Often, acres become profitable by enrolling poor-yielding areas into a conservation program, which has obvious benefits to the environment and to the farm from increased soil organic matter and less nitrate loss. But that’s not the only option, he says.
Some areas of a field with smaller losses can be made profitable with lower fertilizer rates and lower plant populations achieved through variable rate planting. “There’s a lot of guys who have the [variable rate planter] technology but aren’t using it,” Fawcett says. “It’s a learning process.”
Other farmers working with Heartland are switching parts of fields to hay production, not conservation programs, an option Tim Recker also is considering for one 28-acre farm.
For areas that may never be profitable, AgSolver not only estimates profitability of conservation programs, its maps make it easier to visualize a practical fit with cropping in the rest of the field. For example, if flying cover crop seed on that field, some of that seed may be too competitive with pollinator plants.
Other co-ops offer WinField’s R7 Tool that can create a profit map for each field showing areas where income exceeds expenses and other areas that result in operating losses. The R7 Tool also provides access to the companies’ Answer Plot data, summarizing information from more than 200 locations across the U.S. and provides information on how different corn hybrids respond to management.
Keaton Krueger, an agriculture technology specialist for WinField based in Ankeny, Iowa explains that some hybrids differ in their response to population, nitrogen, fungicide and rotation. If you plant in a field or part of a field not able to support their higher yields, you could overapply nitrogen (N), he says. Those areas may not have a high yield potential, but they may still be profitable if the right hybrid and less N is applied along with lower plant populations. “I don’t need to apply N for a 180-bushel yield goal because I know I’m not going to get it,” Krueger says.
Krueger agrees that in some cases taking money-losing areas out of crop production is the best option. But if low-yielding areas in a field can be managed differently to get into the black, “we don’t have to raise yields to make money,” from that field, he says.
Contact any of these experts to evaluate this practice on your farm:
Heath Ellison: hellison@iasoybeans.com; 515-334-1045
Jason Danner: jdanner@heartlandcoop.com; 515-689-5830
Dave Muth: david.muth@agsolver.com; 515-203-3545
Jim Jordahl: jjordahl@iowaagwateralliance.com; 515-334-1079
Keaton Krueger: KKrueger@landolakes.com; (515) 450-2527